Geosharing: Unterschied zwischen den Versionen
Stefan (Diskussion | Beiträge) K |
(→Come with an idea - go home with a web map...) |
||
| (4 dazwischenliegende Versionen von 2 Benutzern werden nicht angezeigt) | |||
| Zeile 10: | Zeile 10: | ||
== Come with an idea - go home with a web map... == | == Come with an idea - go home with a web map... == | ||
| − | * | + | * Training session '''"Come with an idea - go home with a web map: Tools for sharing maps and vector data"''' |
* by @sfkeller and Tobias | * by @sfkeller and Tobias | ||
* held at '''"Workshop on Sharing Geospatial Data"''', 31. oct. 2013 | * held at '''"Workshop on Sharing Geospatial Data"''', 31. oct. 2013 | ||
| Zeile 17: | Zeile 17: | ||
Abstract: When speaking of web maps, Google set the pace and was the one who made these geospatial technologies mainstream. This workshop presents free alternatives. Often they are perhaps less streamlined but more professional and specific to a certain use case. The use case that will be treated here is statistical data which serves as input for a ‚story map‘. This story map tells a story, meaning an idea (provided by the participants) to be visualized by a thematic web map (syn. geovisualization, infographic). So, come along with an idea based on data e.g. from opendata.admin.ch or ‘Hektarraster’ and your laptop if available; no programming needed. | Abstract: When speaking of web maps, Google set the pace and was the one who made these geospatial technologies mainstream. This workshop presents free alternatives. Often they are perhaps less streamlined but more professional and specific to a certain use case. The use case that will be treated here is statistical data which serves as input for a ‚story map‘. This story map tells a story, meaning an idea (provided by the participants) to be visualized by a thematic web map (syn. geovisualization, infographic). So, come along with an idea based on data e.g. from opendata.admin.ch or ‘Hektarraster’ and your laptop if available; no programming needed. | ||
| + | |||
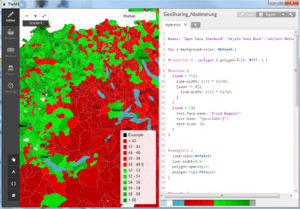
| + | [[Datei:GeoSharing_Abstimmung.PNG|thumb|right|alt=TileMill Screenshot]] | ||
The workshop programme is about the following: | The workshop programme is about the following: | ||
| Zeile 27: | Zeile 29: | ||
# Tools to extract and transform (i.e. convert) vector data | # Tools to extract and transform (i.e. convert) vector data | ||
| − | See | + | See handouts and [[TileMill]]. |
| + | |||
== Shared Material == | == Shared Material == | ||
| − | * | + | * Handouts (presentation slides): [http://de.slideshare.net/StefanKeller/geosharing-2013-bernwskellerhsrslides Slideshare]. |
* Skript of lab exercise: tbd. | * Skript of lab exercise: tbd. | ||
| − | * Data "Workshop Compilation" of lab exercise: | + | * Data "Workshop Compilation" of lab exercise: https://owncloud.hsr.ch/public.php?service=files&t=7880a78a9e2df7d1c40ab75edaebf142 |
Aktuelle Version vom 14. November 2013, 11:39 Uhr
 Definition "Sharing is the joint use of a resource or space. In its narrow sense,
 it refers to joint or alternating use of an inherently finite good, such as a common
 pasture or a shared residence. It is also the process of dividing and distributing."
 (Source: Wikipedia (en), 1.11.2013)
Notes from @sfkeller:
- The process of distributing can also be seen as the last part of the 'publishing' process e.g. cartography and (data driven) journalism.
- Sharing of geospatial data is complicated and hampered because of complexity and novelty/immatureness of the domain.
Come with an idea - go home with a web map...
- Training session "Come with an idea - go home with a web map: Tools for sharing maps and vector data"
- by @sfkeller and Tobias
- held at "Workshop on Sharing Geospatial Data", 31. oct. 2013
- 31. oct. - 2. nov. 2013, University of Bern, Bern
- http://www.geosharing.unibe.ch/
Abstract: When speaking of web maps, Google set the pace and was the one who made these geospatial technologies mainstream. This workshop presents free alternatives. Often they are perhaps less streamlined but more professional and specific to a certain use case. The use case that will be treated here is statistical data which serves as input for a ‚story map‘. This story map tells a story, meaning an idea (provided by the participants) to be visualized by a thematic web map (syn. geovisualization, infographic). So, come along with an idea based on data e.g. from opendata.admin.ch or ‘Hektarraster’ and your laptop if available; no programming needed.
The workshop programme is about the following:
- Basics of thematic mapping and geovisualization
- From the idea and collection of data to the making, publishing and sharing of maps
- Discussion of some free online map making and map publishing tools
- About data access webservices (background maps) and data formats
- Excursus about TileMill and CartoCSS
- Design and publish your own web map (using TileMill)
- Tools to extract and transform (i.e. convert) vector data
See handouts and TileMill.
- Handouts (presentation slides): Slideshare.
- Skript of lab exercise: tbd.
- Data "Workshop Compilation" of lab exercise: https://owncloud.hsr.ch/public.php?service=files&t=7880a78a9e2df7d1c40ab75edaebf142
