Making Maps from OpenStreetMap Data
See also OSM, OpenStreetMap-Daten zu Karten aufbereiten (german)
>> Work in progress... <<
Inhaltsverzeichnis
Overview
This is a how to/knowhow page about making own web maps from OpenStreetMap data.
- If you are looking for making nice own base (or background) maps with own styling for print or web eventually within own region, and without programming skills - then this is the place to look for. Examples of personalized base maps are blind maps (maps without labels), the watercolor map from Stamen, OpenCycleMap among others.
- If you are looking for making a thematic map on top of given base maps, use Maperitive or umap or other applications (see Geovisualisierung (german)). Examples of thematic maps is Wheelmap with infoboxes.
- This is still work in progress. Our plan (see Team below) is to put everything in a single script file (tbd.).
- See also Map Making Overview at OSM Wiki.
Map Gallery
Map by category:
- Topographic map styles:
- Background map styles:
- Muted Base Map (Quiet style) => osm-quiet-la (Quiet L.A.)
- Designed to serve as a muted backdrop for overlaying data visualizations.
- The goal of Quiet L.A. is to remove extraneous detail, but retain enough information for the region to remain recognizable.
- 8-Bit NYC is a lo-fi web map of New York City, inspired by 8-bit video games.
- POI-less map style (de: Karte ohne POIs) => tbd.
- Blank map (de: Stumme Karte) => tbd.
- Grey (B&W) Background Map (de: Schwarz-Weiss-Karte): tbd.
- Muted Base Map (Quiet style) => osm-quiet-la (Quiet L.A.)
- Script map styles:
- Vintage maps => Overview (Syn.: Treasure/Pirate Map; de: Vintage Map)
- Fancy map styles:
- Maps with distinct personalities
- Pinterest - Playful and handcrafted effect
- Buffering and Meta Tiling
- Entropy and Labeling
- Park Conservancy - To get people to the parks
- Shield and Marker Trick
- Symbol Fonts and Unicode Characters
- Map Scraps
- Pinterest - Playful and handcrafted effect
Here are some available maps (map styles) based on OSM data and the database schema (explained below):
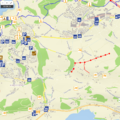
Swiss Style (see also OpenEcoMap)
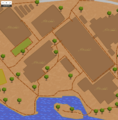
Vintage Map (see also Vintage Maps
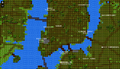
8-bit Cities Map
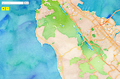
Water Colour
Quiet LA


Cookbook
- Software: tbd.
- Data: tbd.
- Hardware: tbd.
See workflow.
Some background: Making maps actually means in this context transforming a dataset to graphics. Before being styled (or rendered) the dataset is being preprocessed which ultimately would be a one-click process - but it's not yet since technology and user demands are changing fast.
At least, we can make life easeier when the intermediate dataset structure is has some known rules: See e.g. database schema below.
Workflow
Pls. note that this is still work in progress and thus experimental, suboptimal and at worst partially broken.
The workflow consists of following steps:
- Step 0. Define map goals and prepare software and data.
- Step 1. Download, convert and clip OSM data. You can skip to step 2 and jump to step 3 "Style data" if you are in a hurry.
- Step 2. Enhance and preprocess SQLite dataset.
- Step 3. Style data.
- Step 4. Publish map.
As said before, our goal is to wrap step 1 and 2 into one single Python script.
Step 0. Define map goals and prepare software and data
Define map goals:
- Choose from a map style
- or prepare yourself to define an own style.
Prepare software and data:
- Install software: OGR/Python, SpatiaLite, TileMill
- Get config data, e.g. modified osmconf.ini
- Prepare clip boundary (e.g. liechtenstein_schloss_bbox.geojson)
- Search for the desired country boundary from OpenStreetMap and copy the Relation id
- Open http://overpass-turbo.eu/ and insert the commands below with the desired Relation id
- Export the data as geoJSON and open as layer in TileMill
 {type=relation}
 {id=...}
 <osm-script output="json">
 <id-query type="{type}" ref="{id}"/>
 <print mode="body"/>
 <recurse type="down"/>
 <print mode="skeleton"/>
 </osm-script>
- An alternative to obtain the clip boundary is by WIWOSM which is a project to show a wikipedia article geometric objects from OSM.
- For example if you want to clip the boundary of Rapperswil-Jona, simply obtain the Deutsch wikipedia page of Rapperswil-Jona which is http://de.wikipedia.org/wiki/Rapperswil-Jona
- Note the wikipedia tag name (in this case it is Rapperswil-Jona) and replace it with Dresden.
- Also note the language of the wiki and change to the appropriate language abbreviation (lang=de for Deutsch and lang=en for English).
- To obtain the geojson file content, simply open QGIS and Add Vector Layer. Select Protocol and insert the URL with Type as GeoJSON and select Open.
  http://tools.wmflabs.org/wiwosm/osmjson/getGeoJSON.php?lang=de&article=Dresden
  http://tools.wmflabs.org/wiwosm/osmjson/getGeoJSON.php?lang=de&article=Rapperswil-Jona

  http://tools.wmflabs.org/wiwosm/osmjson/getGeoJSON.php?lang=en&article=Dresden
  http://tools.wmflabs.org/wiwosm/osmjson/getGeoJSON.php?lang=en&article=Singapore
Step 1. Download, convert and clip OSM data
- Open command line shell (PBF file in, SQLite/SpatiaLite file out):
 > ogr2ogr -f "SQLite" liechtenstein.sqlite
   /vsicurl/http://download.geofabrik.de/europe/liechtenstein-latest.osm.pbf
   -dsco SPATIALITE=YES -skipfailures -progress -overwrite
   --config OSM_CONFIG_FILE osmconf.ini -gt 65536
   -clipsrc liechtenstein_schloss_bbox.geojson -clipsrclayer OGRGeoJSON
   -nlt PROMOTE_TO_MULTI
Open points:
- Convert coordinates to Mercator?
Alternatives (not used further here; this does not mean they are unusable - in contrary! - but that the are just not considered for different reasons):
- QGIS - reads PDF/OSM data with OGR (like we do here) but with default config and without preprocessing.
- spatialite_osm_map (OSM import tool from Spatialite) - no config of own tag->attribute mapping, no clipping possible?
- osm2pgsql - requires PostGIS which is cumbersome being another local server software.
- osmosis - no tag->attribute mapping?
Step 2a. Enhance SQLite dataset
- Enhance dataset by shuffling geo objects around (using Spatialite, SQLite file in/out)
- Convert Polygons to Points and add them to points as POIs.
- Eventually convert multilinestring to linestring (can TileMill/Mapnik and QGIS handle multilinestrings/multipolygons?).
Step 2b. Do some other preprocessing
- use preprocessing tools (Python, SQLite file in/out)
- line smoothing of streets
- tbd.
Sources:
Ideas:
- DB related:
- Correct typos in tag values
- Correct and unify tag names
- Geometry related:
- Generalise geometry (line simplification and/or line smoothing) streets, forest, water bodies,
Step 3. Style data
- Start TileMill
- TileMill uses CartoCSS as a stylesheet language and is a design environment used for cartography.
- Making boundaries (like from buildings) to make a hand-made effect.
- A ‘sketchy’ look to lines can be achieved by overlaying a number of line attachments with different smoothing values applied. By smoothing higher values, the lines are overlaid using the ‘multiply’ compositing operation. This make areas that overlap more appear darker.
 ::outline1, ::outline2, ::outline3, ::outline4 {
   line-join: round;
   line-color:#773d00;
   line-smooth: 0.05;
   line-width: 0.5;
 }
 ::outline1{ line-smooth: 0.04; }
 ::outline2{ line-smooth: 0.06; }
 ::outline3{ line-smooth: 0.08; }
 ::outline4{ line-smooth: 0.10; }
- Using a specific font which is unavailable in TileMill
- Create a directory to load fonts from in addition to the system directories
- Set up font sets for various weights and styles.
- Some suitable fonts/typefaces for a vintage pirate style are Aquiline and Mutlu
- With the newly added fonts, we can apply it to legends, buildings etc at specific zoom levels and text size to suit the style of your map.
 Map { font-directory: url(./fonts); }
 @piratefont: "Aquiline","Mutlu","French Script MT Regular";
 text-name:'[Name]';
 text-face-name: "Aquiline";
 text-allow-overlap: true; /*Control whether overlapping text is shown or hidden*/
 text-fill:#bdaf5a;
 text-comp-op: color-burn;
 text-size:10;

 [zoom > 15] {text-size:13;}
 [zoom > 17] {text-size:16;}
 [zoom > 19] {text-size:19;}
 [zoom > 20] {text-size:22;}
- Changing colours and texture of different elements and styles interaction with Compositing Operations
- Some popular compositing operations for pirate style map are colour-burn and soft-light.
- For a grainy effect, pick a suitable image with noise. An example is shown here
- You can choose any other types of texture you wish to put on the background (or buildings) on your map by selecting a suitable image.
 polygon-pattern-file: url(img/noise512.png);
 polygon-pattern-comp-op: soft-light;
- Line patterns with images
- Sometimes we want to have different line styles to represent a brown dirty trail or a railway track for example. We first need to have a image file where the size should be rather small - the height of the image will be the width of the line pattern and the width of the image will be repeated along the length of the line.
line-pattern-file:url(img/brownline.png);
- Icons on POIs are important to make the map more interactive and detailed aesthetically.
- For a pirate/vintage map, it is important to have plenty of POIs (like bars/restaurants/gardens) and have an "old fashioned" design icon and style it on the map.
 [type = "restaurant"]{
  marker-file:url(img/restaurant.png);
  marker-width:40;
  [zoom = 22]{marker-width:80;}
  [zoom = 20]{marker-width:20;}
 }
Sources:
- CartoCSS and TileMill
- Ready made icons: Symbolkatalog
Step 4. Publish map
- On paper or on the web
- See e.g. TileMill or Geovisualisierung
Database Schema
Table names and name rules (schema) of OSM data source:
- osm_points
- osm_lines
- osm_polygons
- osm_roads, osm_roads_gen0, ...
- osm_pois
- osm_boundaries (osm_boundaries_gen0, osm_boundaries_gen1, ...)
Table names follow the schema "<prefix>_<name>_<postfix>" e.g. for zoom levels:
- 0-10 => <name>_gen0
- 11-14 => <name>_gen1
- >= 12 => <name>
Auxiliary data source:
- Boundaries
- Terrain
Notes
See also Diskussion:Making Maps from OpenStreetMap Data.
Team
- Prof. Stefan Keller
- Hao Feng Tan