Making Maps from OpenStreetMap Data: Unterschied zwischen den Versionen
HTan (Diskussion | Beiträge) (→Map Gallery) |
Stefan (Diskussion | Beiträge) K (→Overview) |
||
| (27 dazwischenliegende Versionen von 3 Benutzern werden nicht angezeigt) | |||
| Zeile 1: | Zeile 1: | ||
| − | See also [[OSM]], [[OpenStreetMap-Daten zu Karten aufbereiten]] (german) | + | See also [[OSM]], [[OpenStreetMap-Daten zu Karten aufbereiten]] (german) '''>> NOTE: This is work in progress... <<''' |
| − | + | == Overview == | |
| − | + | This is a handbook on making web maps from downloaded [[OpenStreetMap]] data with own styling. | |
| − | + | If you want to make your own nice base-map with your own styling for printing or for publishing on the web without programming skills - then this is the place to look for. Examples of personalized base maps are blind maps (maps without labels), the watercolor map from Stamen and OpenCycleMap among others (see gallery). | |
| − | |||
| − | |||
| − | |||
| − | |||
| − | + | If you are looking for making a thematic map on top of given base maps, use '''[http://umap.openstreetmap.fr/en/ umap]''' as online application or '''[http://maperitive.net/ Maperitive]''' as desktop application (see [[Geovisualisierung]] (german)). An example of a thematic map is [http://wheelmap.org/ Wheelmap] with infoboxes. | |
| − | + | If you are looking for creating printable maps online (downloadable as PDF), try '''[http://maposmatic.org/ MapOSMatic]''' or '''[http://fieldpapers.org/ FieldPapers]'''. | |
| − | |||
| − | |||
| − | |||
| − | |||
| − | |||
| − | |||
| − | |||
| − | |||
| − | |||
| − | |||
| − | |||
| − | |||
| − | |||
| − | |||
| − | |||
| − | |||
| − | |||
| + | See also [http://wiki.openstreetmap.org/wiki/Map_Making_Overview Map Making Overview] at the official OSM Wiki. | ||
| − | '' | + | NOTE: ''This is still work in progress. Our plan (see Team below) is to put everything in a single script file (tbd.).'' |
| − | |||
| − | |||
| − | |||
| − | |||
| − | |||
| − | |||
| − | |||
| − | |||
| + | == Map Gallery == | ||
Here are some available maps (map styles) based on OSM data and the database schema (explained below): | Here are some available maps (map styles) based on OSM data and the database schema (explained below): | ||
| − | |||
<gallery> | <gallery> | ||
Datei:ScreenOpenEcoMap.PNG|Swiss Style (see also [[OpenEcoMap]]) | Datei:ScreenOpenEcoMap.PNG|Swiss Style (see also [[OpenEcoMap]]) | ||
| − | Datei:TreasureMap.PNG|Vintage Map (see also [[Vintage Maps]] | + | Datei:TreasureMap.PNG|Vintage Map (see also [[Vintage Maps]]) |
| + | Datei:Quiet_LA.png|Quiet LA (see also [[Quiet Maps]]) | ||
| + | Datei:Hand_drawn_map.png|Hand Drawn Map | ||
Datei:8-bit_Cities.png|8-bit Cities Map | Datei:8-bit_Cities.png|8-bit Cities Map | ||
Datei:Water Colour.png|Water Colour | Datei:Water Colour.png|Water Colour | ||
| − | Datei: | + | Datei:Space map.jpg|Space Station Earth Map |
| + | Datei:Toner.png|Toner | ||
</gallery> | </gallery> | ||
| + | |||
| + | Here are some other maps by category: | ||
| + | * Topographic map styles: | ||
| + | ** OSM default style => [http://www.osm.org/#16/47.2251/8.8264 osm.org] (''Slippy Map'') | ||
| + | ** Swiss OSM style => [http://www.osm.ch/#16/47.2251/8.8264 osm.ch] (de: ''Schweizer Kartenstil'') | ||
| + | * Background map styles: | ||
| + | ** Muted Base Map (Quiet style) => [http://datadesk.latimes.com/posts/2012/11/introducing-quiet-la/ (''Quiet L.A.'')] | ||
| + | *** Designed to serve as a muted backdrop for overlaying data visualizations. | ||
| + | *** The goal of ''Quiet L.A.'' is to remove extraneous detail, but retain enough information for the region to remain recognizable. | ||
| + | ** [http://8bitcity.com/map 8-Bit NYC] is a lo-fi web map of New York City, inspired by 8-bit video games. | ||
| + | ** POI-less map style (de: ''Karte ohne POIs)'' => tbd. | ||
| + | ** Blank map (de: Stumme Karte) => tbd. | ||
| + | ** Grey (B&W) Background Map (de: Schwarz-Weiss-Karte): tbd. | ||
| + | * Script map styles: | ||
| + | ** Vintage maps => [[Vintage Maps|Overview]] (Syn.: Treasure/Pirate Map; de: ''Vintage Map'') | ||
| + | * Fancy map styles: | ||
| + | ** [http://maps.stamen.com/#watercolor/12/47.2524/8.7375 Watercolor] | ||
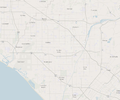
| + | ** [http://maps.stamen.com/toner/#12/37.3157/-122.0586 Toner] | ||
| + | ** Space themed map style => [https://www.mapbox.com/blog/space-station-earth/ Space Station Earth] | ||
| + | ** Hand drawn map style => [http://dessine-moi-une-ville.makina-corpus.net/#13/43.5745/1.4868 A hand drawn map of Toulouse] | ||
| + | ** [http://www.openwhatevermap.org/ OpenWhateverMap] | ||
| + | * Maps with distinct personalities: | ||
| + | ** Pinterest - Playful and handcrafted effect: Buffering and Meta Tiling, Entropy and Labeling | ||
| + | ** Park Conservancy - To get people to the parks: Shield and Marker Trick, Symbol Fonts and Unicode Characters, Map Scraps | ||
== Cookbook == | == Cookbook == | ||
| Zeile 66: | Zeile 65: | ||
At least, we can make life easeier when the intermediate dataset structure is has some known rules: See e.g. database schema below. | At least, we can make life easeier when the intermediate dataset structure is has some known rules: See e.g. database schema below. | ||
| − | + | Workflow: | |
| − | + | * Pls. note that this is still work in progress and thus experimental, suboptimal and at worst partially broken. | |
| − | Pls. note that this is still work in progress and thus experimental, suboptimal and at worst partially broken. | + | * The workflow consists of following steps: |
| − | + | ** Step 0. Define map goals and prepare software and data. | |
| − | The workflow consists of following steps: | + | ** Step 1. Download, convert and clip OSM data. You can skip to step 2 and jump to step 3 "Style data" if you are in a hurry. |
| − | * Step 0. Define map goals and prepare software and data. | + | ** Step 2. Enhance and preprocess SQLite dataset. |
| − | * Step 1. Download, convert and clip OSM data. You can skip to step 2 and jump to step 3 "Style data" if you are in a hurry. | + | ** Step 3. Style data. |
| − | * Step 2. Enhance and preprocess SQLite dataset. | + | ** Step 4. Publish map. |
| − | * Step 3. Style data. | ||
| − | * Step 4. Publish map. | ||
As said before, our goal is to wrap step 1 and 2 into one single Python script. | As said before, our goal is to wrap step 1 and 2 into one single Python script. | ||
| Zeile 122: | Zeile 119: | ||
-clipsrc liechtenstein_schloss_bbox.geojson -clipsrclayer OGRGeoJSON | -clipsrc liechtenstein_schloss_bbox.geojson -clipsrclayer OGRGeoJSON | ||
-nlt PROMOTE_TO_MULTI | -nlt PROMOTE_TO_MULTI | ||
| + | |||
Open points: | Open points: | ||
| Zeile 155: | Zeile 153: | ||
* Start [[TileMill]] | * Start [[TileMill]] | ||
**TileMill uses CartoCSS as a stylesheet language and is a design environment used for cartography. | **TileMill uses CartoCSS as a stylesheet language and is a design environment used for cartography. | ||
| − | |||
| − | |||
| − | |||
| − | |||
| − | |||
| − | |||
| − | |||
| − | |||
| − | |||
| − | |||
| − | |||
| − | |||
| − | |||
| − | |||
| − | |||
*Using a specific font which is unavailable in TileMill | *Using a specific font which is unavailable in TileMill | ||
| Zeile 206: | Zeile 189: | ||
*Icons on POIs are important to make the map more interactive and detailed aesthetically. | *Icons on POIs are important to make the map more interactive and detailed aesthetically. | ||
| − | |||
[type = "restaurant"]{ | [type = "restaurant"]{ | ||
Aktuelle Version vom 22. August 2014, 01:04 Uhr
See also OSM, OpenStreetMap-Daten zu Karten aufbereiten (german) >> NOTE: This is work in progress... <<
Inhaltsverzeichnis
Overview
This is a handbook on making web maps from downloaded OpenStreetMap data with own styling.
If you want to make your own nice base-map with your own styling for printing or for publishing on the web without programming skills - then this is the place to look for. Examples of personalized base maps are blind maps (maps without labels), the watercolor map from Stamen and OpenCycleMap among others (see gallery).
If you are looking for making a thematic map on top of given base maps, use umap as online application or Maperitive as desktop application (see Geovisualisierung (german)). An example of a thematic map is Wheelmap with infoboxes.
If you are looking for creating printable maps online (downloadable as PDF), try MapOSMatic or FieldPapers.
See also Map Making Overview at the official OSM Wiki.
NOTE: This is still work in progress. Our plan (see Team below) is to put everything in a single script file (tbd.).
Map Gallery
Here are some available maps (map styles) based on OSM data and the database schema (explained below):
Swiss Style (see also OpenEcoMap)
Vintage Map (see also Vintage Maps)
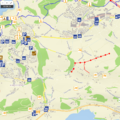
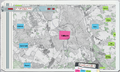
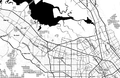
Quiet LA (see also Quiet Maps)
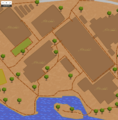
Hand Drawn Map
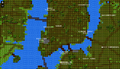
8-bit Cities Map
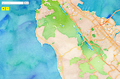
Water Colour
Space Station Earth Map
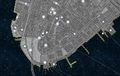
Toner


Here are some other maps by category:
- Topographic map styles:
- Background map styles:
- Muted Base Map (Quiet style) => (Quiet L.A.)
- Designed to serve as a muted backdrop for overlaying data visualizations.
- The goal of Quiet L.A. is to remove extraneous detail, but retain enough information for the region to remain recognizable.
- 8-Bit NYC is a lo-fi web map of New York City, inspired by 8-bit video games.
- POI-less map style (de: Karte ohne POIs) => tbd.
- Blank map (de: Stumme Karte) => tbd.
- Grey (B&W) Background Map (de: Schwarz-Weiss-Karte): tbd.
- Muted Base Map (Quiet style) => (Quiet L.A.)
- Script map styles:
- Vintage maps => Overview (Syn.: Treasure/Pirate Map; de: Vintage Map)
- Fancy map styles:
- Watercolor
- Toner
- Space themed map style => Space Station Earth
- Hand drawn map style => A hand drawn map of Toulouse
- OpenWhateverMap
- Maps with distinct personalities:
- Pinterest - Playful and handcrafted effect: Buffering and Meta Tiling, Entropy and Labeling
- Park Conservancy - To get people to the parks: Shield and Marker Trick, Symbol Fonts and Unicode Characters, Map Scraps
Cookbook
- Software: tbd.
- Data: tbd.
- Hardware: tbd.
See workflow.
Some background: Making maps actually means in this context transforming a dataset to graphics. Before being styled (or rendered) the dataset is being preprocessed which ultimately would be a one-click process - but it's not yet since technology and user demands are changing fast.
At least, we can make life easeier when the intermediate dataset structure is has some known rules: See e.g. database schema below.
Workflow:
- Pls. note that this is still work in progress and thus experimental, suboptimal and at worst partially broken.
- The workflow consists of following steps:
- Step 0. Define map goals and prepare software and data.
- Step 1. Download, convert and clip OSM data. You can skip to step 2 and jump to step 3 "Style data" if you are in a hurry.
- Step 2. Enhance and preprocess SQLite dataset.
- Step 3. Style data.
- Step 4. Publish map.
As said before, our goal is to wrap step 1 and 2 into one single Python script.
Step 0. Define map goals and prepare software and data
Define map goals:
- Choose from a map style
- or prepare yourself to define an own style.
Prepare software and data:
- Install software: OGR/Python, SpatiaLite, TileMill
- Get config data, e.g. modified osmconf.ini
- Prepare clip boundary (e.g. liechtenstein_schloss_bbox.geojson)
- Search for the desired country boundary from OpenStreetMap and copy the Relation id
- Open http://overpass-turbo.eu/ and insert the commands below with the desired Relation id
- Export the data as geoJSON and open as layer in TileMill
 {type=relation}
 {id=...}
 <osm-script output="json">
 <id-query type="{type}" ref="{id}"/>
 <print mode="body"/>
 <recurse type="down"/>
 <print mode="skeleton"/>
 </osm-script>
- An alternative to obtain the clip boundary is by WIWOSM which is a project to show a wikipedia article geometric objects from OSM.
- For example if you want to clip the boundary of Rapperswil-Jona, simply obtain the Deutsch wikipedia page of Rapperswil-Jona which is http://de.wikipedia.org/wiki/Rapperswil-Jona
- Note the wikipedia tag name (in this case it is Rapperswil-Jona) and replace it with Dresden.
- Also note the language of the wiki and change to the appropriate language abbreviation (lang=de for Deutsch and lang=en for English).
- To obtain the geojson file content, simply open QGIS and Add Vector Layer. Select Protocol and insert the URL with Type as GeoJSON and select Open.
  http://tools.wmflabs.org/wiwosm/osmjson/getGeoJSON.php?lang=de&article=Dresden
  http://tools.wmflabs.org/wiwosm/osmjson/getGeoJSON.php?lang=de&article=Rapperswil-Jona

  http://tools.wmflabs.org/wiwosm/osmjson/getGeoJSON.php?lang=en&article=Dresden
  http://tools.wmflabs.org/wiwosm/osmjson/getGeoJSON.php?lang=en&article=Singapore
Step 1. Download, convert and clip OSM data
- Open command line shell (PBF file in, SQLite/SpatiaLite file out):
 > ogr2ogr -f "SQLite" liechtenstein.sqlite
   /vsicurl/http://download.geofabrik.de/europe/liechtenstein-latest.osm.pbf
   -dsco SPATIALITE=YES -skipfailures -progress -overwrite
   --config OSM_CONFIG_FILE osmconf.ini -gt 65536
   -clipsrc liechtenstein_schloss_bbox.geojson -clipsrclayer OGRGeoJSON
   -nlt PROMOTE_TO_MULTI
Open points:
- Convert coordinates to Mercator?
Alternatives (not used further here; this does not mean they are unusable - in contrary! - but that the are just not considered for different reasons):
- QGIS - reads PDF/OSM data with OGR (like we do here) but with default config and without preprocessing.
- spatialite_osm_map (OSM import tool from Spatialite) - no config of own tag->attribute mapping, no clipping possible?
- osm2pgsql - requires PostGIS which is cumbersome being another local server software.
- osmosis - no tag->attribute mapping?
Step 2a. Enhance SQLite dataset
- Enhance dataset by shuffling geo objects around (using Spatialite, SQLite file in/out)
- Convert Polygons to Points and add them to points as POIs.
- Eventually convert multilinestring to linestring (can TileMill/Mapnik and QGIS handle multilinestrings/multipolygons?).
Step 2b. Do some other preprocessing
- use preprocessing tools (Python, SQLite file in/out)
- line smoothing of streets
- tbd.
Sources:
Ideas:
- DB related:
- Correct typos in tag values
- Correct and unify tag names
- Geometry related:
- Generalise geometry (line simplification and/or line smoothing) streets, forest, water bodies,
Step 3. Style data
- Start TileMill
- TileMill uses CartoCSS as a stylesheet language and is a design environment used for cartography.
- Using a specific font which is unavailable in TileMill
- Create a directory to load fonts from in addition to the system directories
- Set up font sets for various weights and styles.
- Some suitable fonts/typefaces for a vintage pirate style are Aquiline and Mutlu
- With the newly added fonts, we can apply it to legends, buildings etc at specific zoom levels and text size to suit the style of your map.
 Map { font-directory: url(./fonts); }
 @piratefont: "Aquiline","Mutlu","French Script MT Regular";
 text-name:'[Name]';
 text-face-name: "Aquiline";
 text-allow-overlap: true; /*Control whether overlapping text is shown or hidden*/
 text-fill:#bdaf5a;
 text-comp-op: color-burn;
 text-size:10;

 [zoom > 15] {text-size:13;}
 [zoom > 17] {text-size:16;}
 [zoom > 19] {text-size:19;}
 [zoom > 20] {text-size:22;}
- Changing colours and texture of different elements and styles interaction with Compositing Operations
- Some popular compositing operations for pirate style map are colour-burn and soft-light.
- For a grainy effect, pick a suitable image with noise. An example is shown here
- You can choose any other types of texture you wish to put on the background (or buildings) on your map by selecting a suitable image.
 polygon-pattern-file: url(img/noise512.png);
 polygon-pattern-comp-op: soft-light;
- Line patterns with images
- Sometimes we want to have different line styles to represent a brown dirty trail or a railway track for example. We first need to have a image file where the size should be rather small - the height of the image will be the width of the line pattern and the width of the image will be repeated along the length of the line.
line-pattern-file:url(img/brownline.png);
- Icons on POIs are important to make the map more interactive and detailed aesthetically.
 [type = "restaurant"]{
  marker-file:url(img/restaurant.png);
  marker-width:40;
  [zoom = 22]{marker-width:80;}
  [zoom = 20]{marker-width:20;}
 }
Sources:
- CartoCSS and TileMill
- Ready made icons: Symbolkatalog
Step 4. Publish map
- On paper or on the web
- See e.g. TileMill or Geovisualisierung
Database Schema
Table names and name rules (schema) of OSM data source:
- osm_points
- osm_lines
- osm_polygons
- osm_roads, osm_roads_gen0, ...
- osm_pois
- osm_boundaries (osm_boundaries_gen0, osm_boundaries_gen1, ...)
Table names follow the schema "<prefix>_<name>_<postfix>" e.g. for zoom levels:
- 0-10 => <name>_gen0
- 11-14 => <name>_gen1
- >= 12 => <name>
Auxiliary data source:
- Boundaries
- Terrain
Notes
See also Diskussion:Making Maps from OpenStreetMap Data.
Team
- Prof. Stefan Keller
- Hao Feng Tan